Health and alerts
Detect provider or gateway degradation early and remove unhealthy targets from future route selection.
Analytics serves three different jobs: customer reporting, commercial reconciliation, and operational diagnosis. Pick the narrowest view that answers the question instead of exporting request-level data by default.
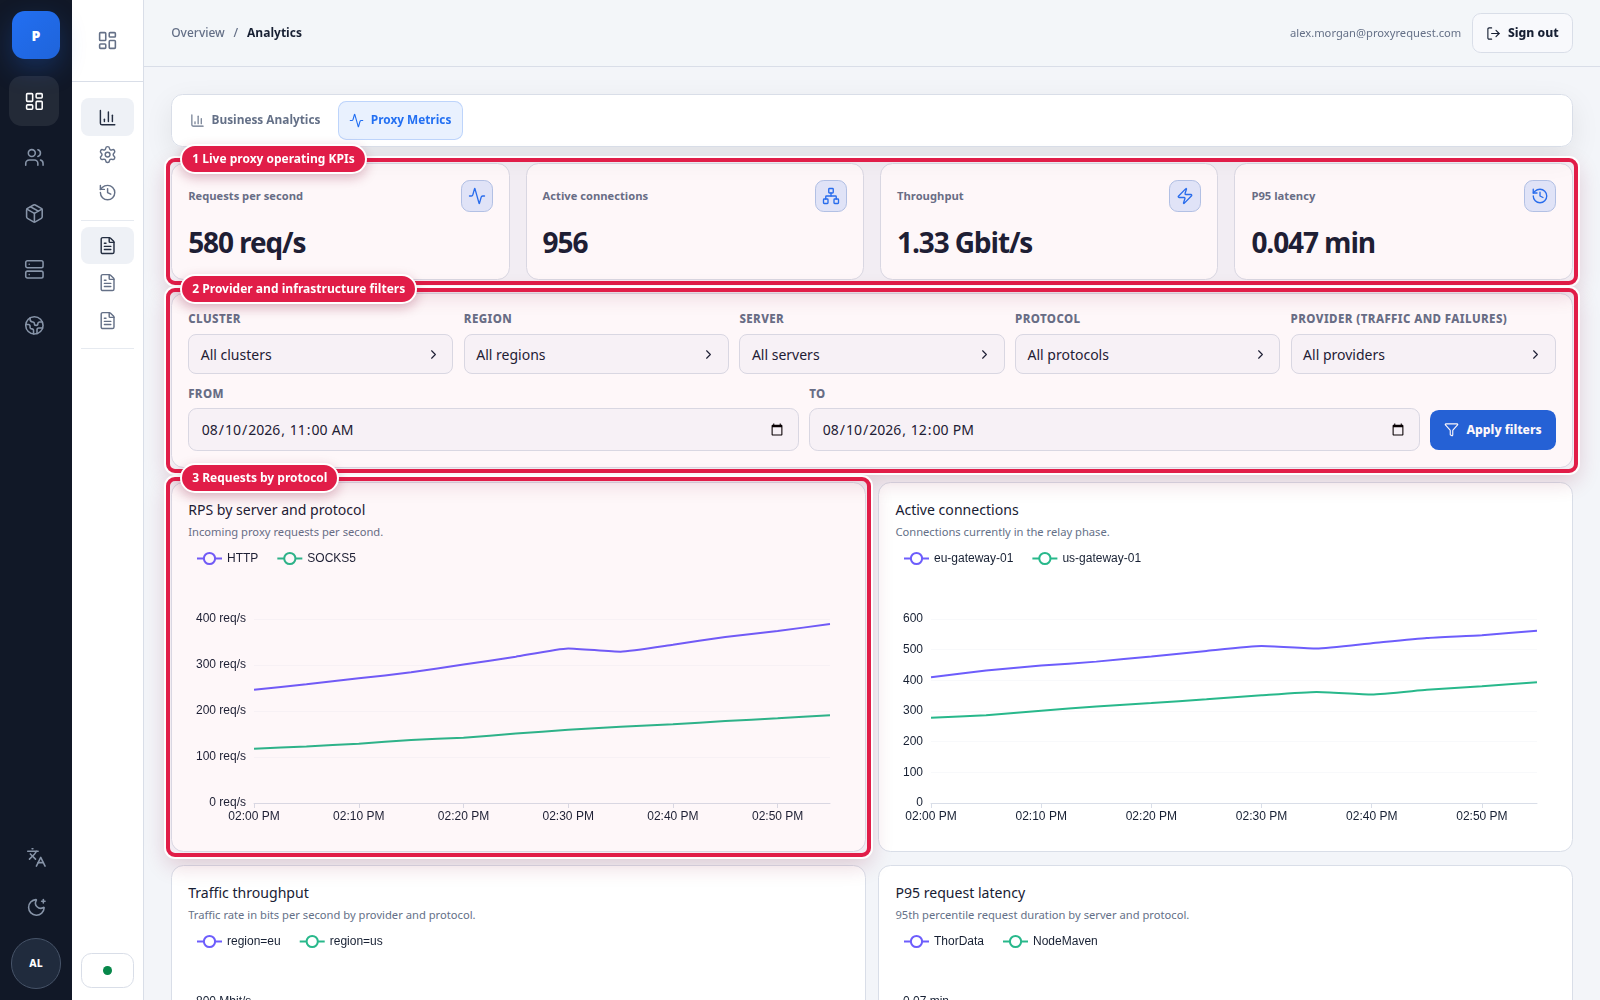
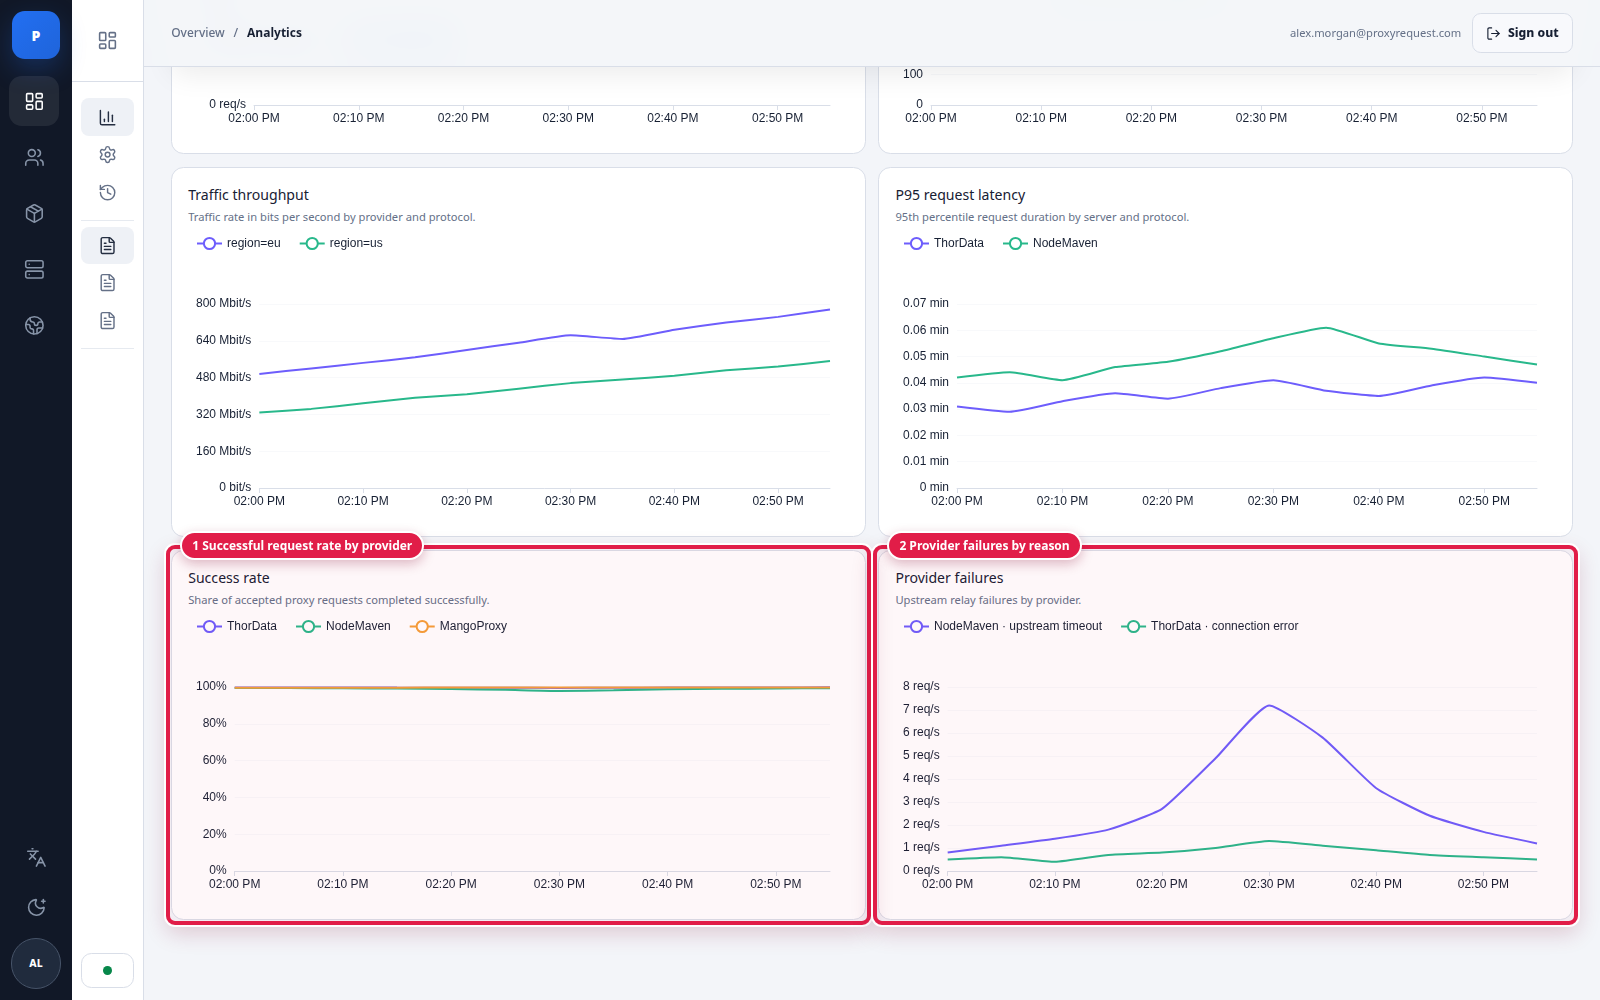
Open Analytics → Proxy Metrics when the question is about current proxy behavior, infrastructure load, or upstream provider degradation. The summary cards show requests per second, active connections, throughput, and P95 request latency. The panels below add success rate and provider failures to the same time window.
 Open full size
Use one scope across every operational signal before comparing gateways or upstream providers.
 Open full size
Compare latency, completion rate, and upstream failure reasons over the same incident window before changing routing.
Use short windows for active incidents and expand the range only when you need a baseline; the maximum selectable window is 31 days. A warning means one or more panels are partial, while an unavailable state means the metrics datasource could not provide a usable dashboard. These states are evidence for an investigation, not automated remediation or an incident-history system.
 Open full size
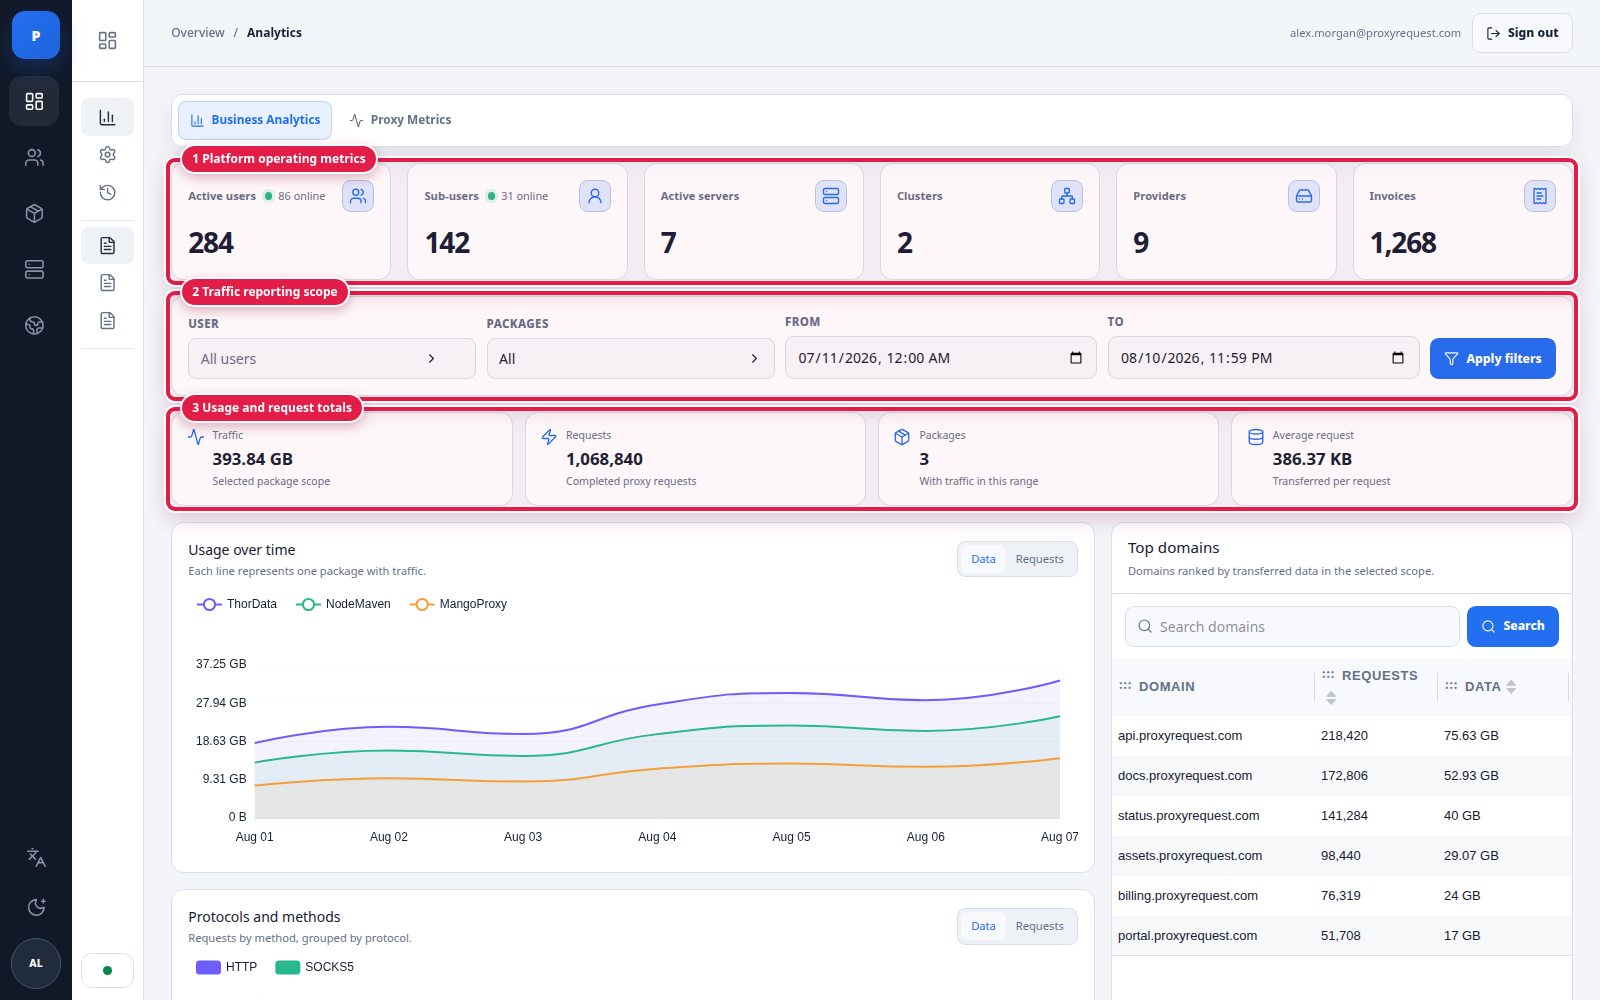
The overview keeps traffic trend on the left and popular domains on the right so volume and destination concentration can be read together.
| Surface | Best question | Important dimensions |
|---|---|---|
| Dashboard / overall | How much traffic and how many requests occurred over time? | Window, user, one or more packages, data/requests |
| Popular domains | Which destinations generated the most requests or bytes? | Hostname, package, customer, window |
| Request journal / feed | What happened in a user’s or order’s request stream? | Package, domain, protocol, method, route context, exact date-time window |
| Proxy logs | Why did a request fail? | Request ID, error code/message, status, user, destination, route and time |
| Connections | How many connections are active now? | User, package, server IP, connection count |
| Transactions | Which data transactions were recorded for this scope? | Sender, recipient, type, package, amount, timestamp |
| Resource charts | How is traffic distributed by provider, package, cluster, or server? | Resource identity, bytes/requests, date window, optional package scope |
Use overall traffic for trends and closed-window totals; use popular domains for ranked concentration without downloading every request row. The protocol-and-method chart is platform-wide because those aggregate records do not contain a user identifier; it is intentionally not shown on a single-user edit page.
Use explicit start, end, and IANA timezone values when reproducing a report. Short windows can use hourly buckets; longer windows can use daily buckets. Store the requested window alongside any exported or reconciled result.
For request journals, defaulting to the previous 24 hours is a useful operational window. Allow both date and time input so support can isolate an incident without reading an entire day. Filters should permit all packages or one/multiple packages, protocol, and domain search where the view supports them.
Structured application logs should include request ID, authenticated user ID, method, path, status/error code, exception type, root exception details, and a traceback for unexpected server errors. Keep secret fields out of that context.
Webhooks can be delayed, retried, batched, or coalesced. Reconcile a completed period independently:
Do not calculate invoices from the number of webhook deliveries or request rows. Use defined commercial byte totals and durable entitlement state. The transaction list is not a complete ledger history: current quota allocations also have administrative audit evidence, and bucket expiration can reduce usable data without proxy consumption. Reconcile your own purchase and allocation records against order and ledger state, not transaction rows alone.
Health and alerts
Detect provider or gateway degradation early and remove unhealthy targets from future route selection.
Incident history
Record impact window, affected packages/locations, mitigation, supplier reference, and resolution.
Audit log
Explain administrative configuration and balance changes separately from customer traffic.
Customer status
Publish only verified scope and avoid promising transparent replay or a new exit IP on every retry.
Distributed tracing is not a provided customer surface. Use request IDs, timestamps, user/order/package mappings, gateway context, feed rows, logs, health, and audit records to build the incident chain.
Continue with infrastructure and launch for capacity controls and production-readiness checks.